การวางแผนและควบคุมการผลิต ครั้งที่3 การพยากรณ์การผลิต 2
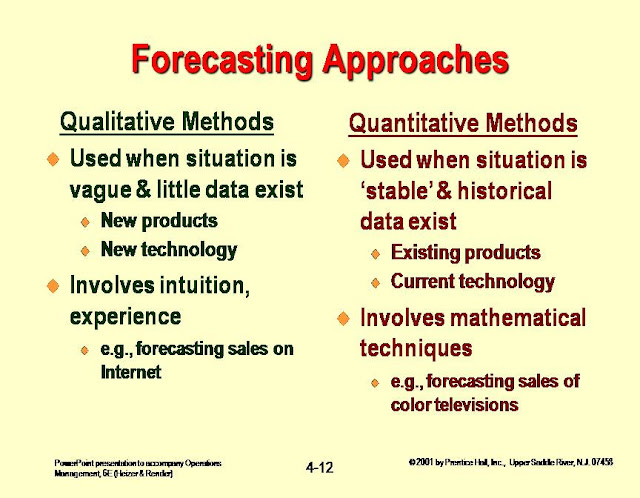
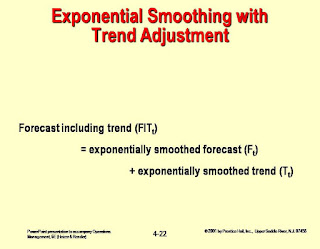
การพยากรณ์การผลิต เพื่อนำไปวางแผนการผลิต ดังนั้นจึงต้องเลือกวิธีพยากรที่เหมาะสมและแม่นยำโดยพิจารณาจากรูปแบบการผลิต วงจรชีวิตผลิตภัณฑ์และช่วงเวลา
ให้นักศึกษาทำคำถามท้ายบทข้อ1และ2
1. พ่อค้าขายผลไม้เก็บข้อมูลยอดขายส้มทุกวันเป็นเวลา 12 วัน ได้ข้อมูลดังตาราง
วันที่
|
ยอดขาย (กิโลกรัม)
|
วันที่
|
ยอดขาย (กิโลกรัม)
|
1
|
25
|
7
|
35
|
2
|
31
|
8
|
32
|
3
|
29
|
9
|
38
|
4
|
33
|
10
|
40
|
5
|
34
|
11
|
37
|
6
|
37
|
12
|
32
|
ก. จงพยากรณ์ยอดขายของวันที่ 3 ถึงวันที่ 13 เมื่อใช้วิธีค่าเฉลี่ยเคลื่อนที่ 2 ช่วงเวลา
ข. จงพยากรณ์ยอดขายของวันที่ 6 ถึงวันที่ 13 เมื่อใช้วิธีค่าเฉลี่ยเคลื่อนที่ 5 ช่วงเวลา
ค. พลอตกราฟแสดงข้อมูลที่บันทึกไว้และค่าพยากรณ์จากข้อ ก. และ ข. ลงบนกราฟเดียวกัน
2.
จงใช้วิธีการพยากรณ์แบบเอ็กซ์โปเนนเชียลปรับเรียบ ที่เป็น
0.2
กำหนดให้ค่าพยากรณ์ของช่วงเวลาที่
1 เป็น 7 (F1 = 7)
ช่วงเวลาที่
|
ความต้องการ
(หน่วย)
|
1
|
11
|
2
|
9
|
3
|
8
|
4
|
9
|
5
|
13
|
6
|
8
|
Case Study 1
Akron Zoological ParkDuring the late 1980s, global changes in consumer preferences for radial tires, inflation, and changes in governmental priorities, almost resulted in the permanent closing of the Akron Children’s Zoo. Lagging attendance and a low membership level did not help matters. Faced with uncertain prospects, the city of Akron opted out of the zoo business. In response, the Akron Zoological Park was organized as a corporation to operate the zoo under contract with the city.Annual Attendance at the Akron Zoological Park To be successful, the zoo must maintain its image as a quality place for its visitors to spend their time. Its animal exhibits are clean and neat. The animals, birds, and reptiles look well cared for. As resources become available for construction and continuing operations, the zoo also keeps adding new exhibits and activities. The independent organization’s efforts seem to be working, because attendance increased from 53,353 in 1989 to an all-time record of 133,762 in 1994.Due to its northern climate, the zoo’s open season lasts from mid-April until mid-October. It reopens for 1 week at Halloween and for the month of December. Zoo attendance depends largely on the weather. For example, attendance was down during the month of December 1995, which established many local records for the coldest temperature and the most snow. Variations in weather also affect crop yields and prices of fresh animal foods, thereby influencing the costs of animal maintenance.In normal circumstances, the zoo may be able to achieve its target goal and attract an annual attendance equal to 40% of its community. Akron has not grown appreciably during the past decade. But the zoo became known as an innovative community resource, and as indicated in the table, annual paid attendance has doubled. Approximately 35% of all visitors are adults. Children account for one half of the paid attendance. Group admissions remain a constant 15% of attendance.The zoo does not have an advertising budget. To gain exposure in its market, it depends on public service announcements, the zoo’s public television series, and local press coverage of its activities. Many of these activities are only a few years old and are a strong reason why attendance has increased.Although the zoo is a nonprofit organization, it must ensure that its income sources equal or exceed operating and physical plant costs. Its continued existence remains totally dependent on its ability to generate revenues while reducing its expenses.
DISCUSSION QUESTIONS1. The president of the Akron Zoo has asked you to calculate the expected gate admittance figures and revenues for both 1999 and 2000. Would simple linear-regression analysis be the appropriate forecasting technique?
The Akron Zoological Park
|
The instructor can use this question to have the student calculate a simple linear regression using real-world data. The idea is that attendance is a linear function of expected admission fees. Also, the instructor can broaden this question to include several other forecast techniques. For example, exponential smoothing, last-period demand, or n-period moving average can be assigned. It can be explained that mean absolute deviation (MAD) is but one of a few methods by which an analyst can select the more appropriate forecast technique and outcome.
First, we perform a linear regression with time as the independent variable. The model that results is:

So the forecasts for 1999 and 2000 are 145,519 and 154,716, respectively. Using a weighted average of $2.875 to represent gate receipts per person, revenues for 1999 and 2000 are $418,367 and $444,808, respectively.
To complicate the situation further, students may legitimately use a regression model to forecast admission fees for each of the three categories or for the weighted average fee. This number would then replace $2.875.
Here is the result of a linear regression using weighted average admission fees as the predicting (independent) variable. Weights are obtained each year by taking 35% of adult fees, plus 50% of children’s fees, plus 15% of group fees. The weighted fees each year (1989–1998) are: $0.975, $0.975, $0.975, $0.975, $1.275, $1.775, $1.775, $2.275, $2.20, and $2.875.
Gate admissions = 31,451 + 39,614 Average fee in given year

If we assume admission fees are not raised in 1999 and 2000, expected gate admissions = 145,341 in each year and revenues = $417,856.
Comparing the earlier time-series model to this second regression, we note that the r is higher and MAD and MSE are lower in the time-series approach.


ไม่มีความคิดเห็น:
แสดงความคิดเห็น